
Delivery Radar
Overview
The Problem
All too often teams are forced to resort to “watermelon reporting” - positively reporting projects that look Green on the outside, only for a closer deep-dive to reveal that it’s actually Red to the core. The reasons for this are usually due to a lack of quality data leading to an over-reliance on the opinions of a few individuals.
The Solution
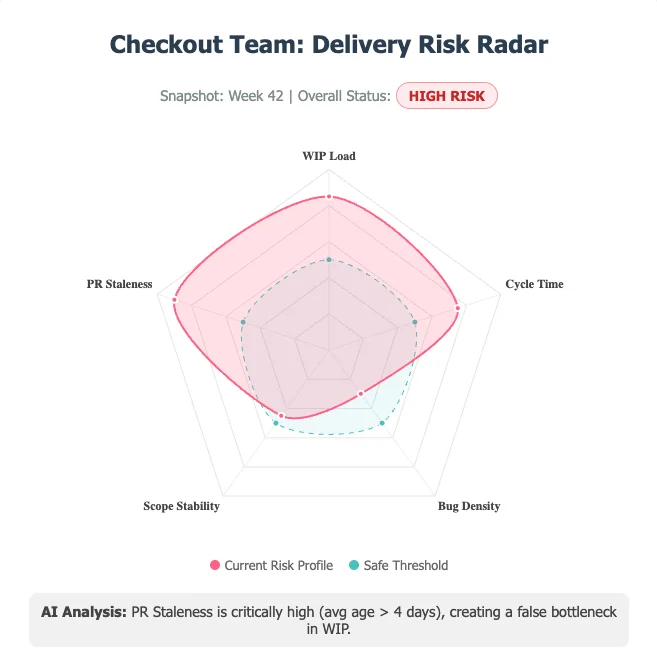
The Delivery Health & Risk Radar. An automated, AI-enhanced dashboard that triangulates data from Jira and GitHub to give a real-time, objective view of delivery health.
The Business ROI
-
Predictability over Optimism: Instead of asking “How does the team feel?”, the Radar flags objective risks (e.g., “WIP is up 40%, Cycle Time has slowed”). It detects slippage weeks before a human would flag it.
-
Actionable AI Intelligence: It doesn’t just show charts; it prescribes actions. AI analyses trends to suggest concrete fixes, such as “Split Epic X due to complexity” or “Pause new work to clear PR backlog,” This empowers us to steer the ship, not just watch it sink.
-
Operational Efficiency: By automating data triangulation, we reduce status prep time for Engineering Managers by 75% (from 2 hours to 30 mins per week), freeing them to focus on coaching and delivery execution.
Project Status
This project is in-progress.